How to use Livespace to monitor and analyze sales
Agnieszka Zawadka
To give you a better idea of how Livespace can support the process of sales monitoring and analysis, we’ve prepared a few examples in which we explain which functions of the system are especially worth using. Expect practical step-by-step instructions that will help you immediately implement new sales management techniques and make better use of this CRM system’s capabilities.
1. Setting tasks for the team
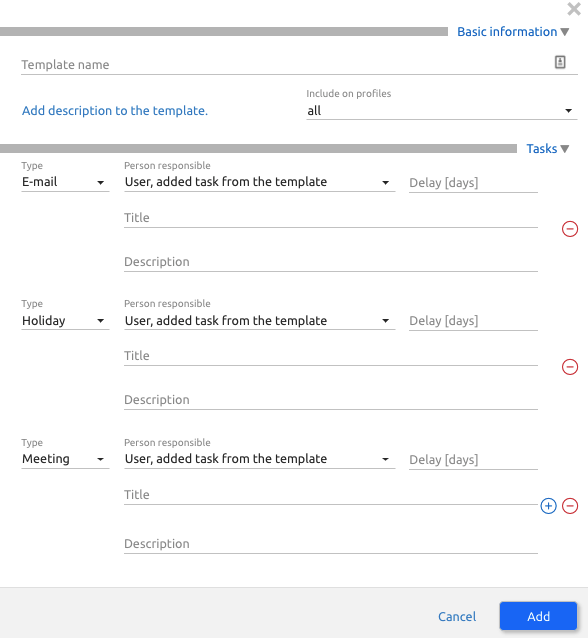
According to the approach called activity-based selling, the key to the success of sales activities is the execution of individual tasks. Livespace makes it possible to create task templates that can then be instantly used, allowing to save time on manual assignment of activities. This is especially useful when a new person joins the sales team – the list of activities in the CRM system will show him/her the direction of activities.
To create a task template, go to Account settings > Calendar and tasks > Task templates > Add template.
Now you can start setting and adding tasks that are crucial for your work.
2. Monitoring the team’s activity
Livespace supports self-discipline in the team and allows the sales manager to monitor the execution of the team’s tasks. Activity statistics allow to track specific activities being reported in Livespace. Thanks to this, you can check at any time how many contacts have been recently added, how many meetings have been held, or how many emails have been sent to customers.
To do this, go to Statistics > Activities.
Livespace makes it possible to filter data using a selected time period, and check the status of activities both for the whole company and for individual team members.
In addition, the Timing view shows a graph with the time when a given activity was the greatest, and the By person view allows to check what percentage of the activity was carried out by a particular salesperson.
Activity statistics can be easily exported to an .XLS spreadsheet.
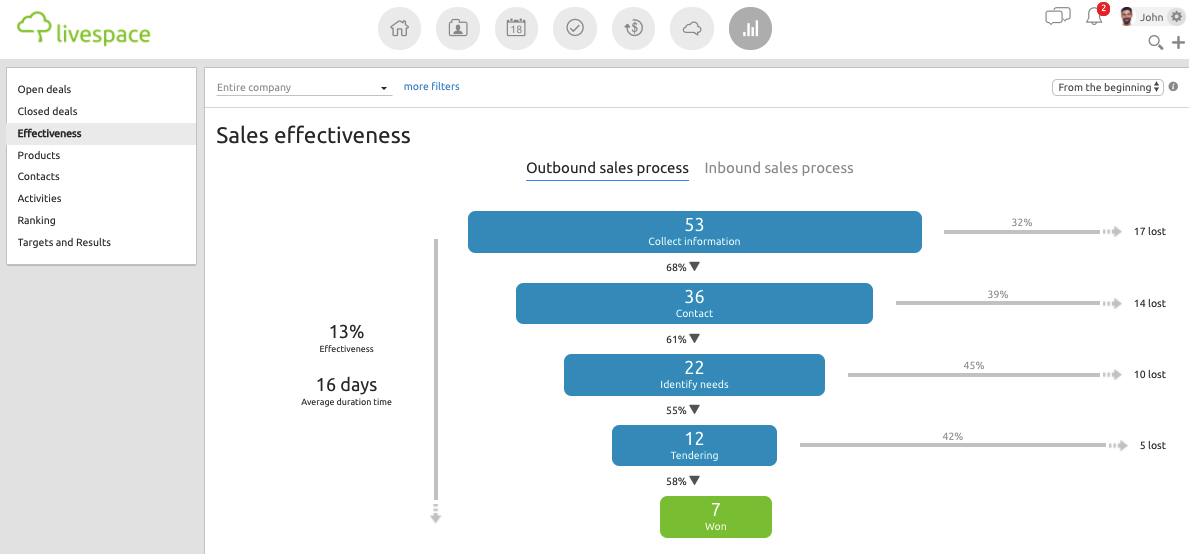
3. Monitoring sales effectiveness
To check the sales effectiveness statistics, all you need to do is go to Statistics in the top menu.
The Sales process section allows to analyze individual stages and activities of the sales funnel and to quickly draw conclusions as to which of them make you lose the most sales opportunities. The data are refreshed in real time, allowing you to react on an ongoing basis and introduce corrective activities.
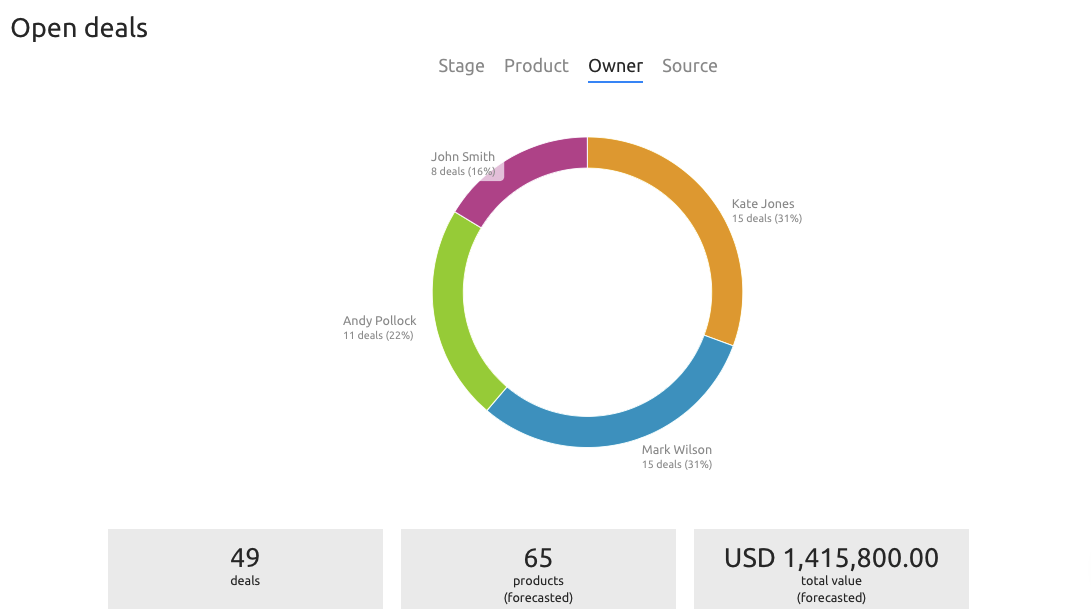
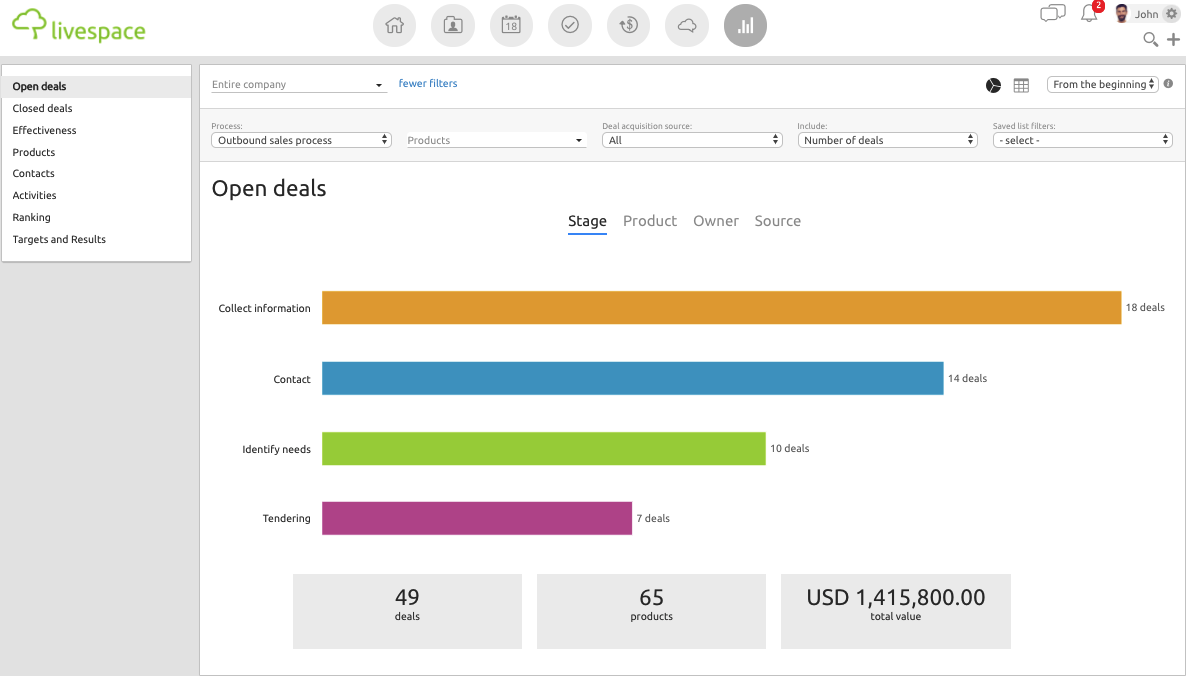
By selecting the appropriate section on the left, you can check the statistics for open and closed deals.
If you go to Owner, you can see how sales are distributed among individual team members.
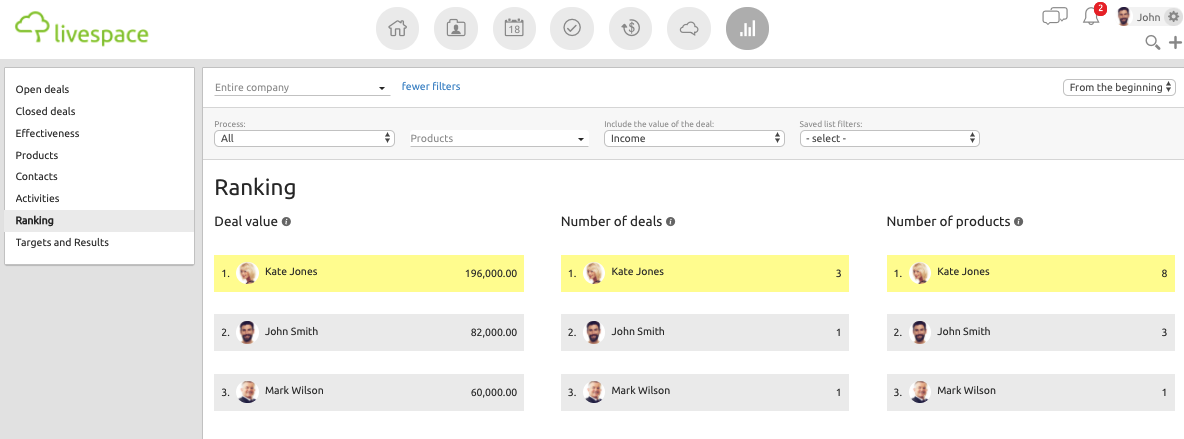
At this point, it’s also very helpful to go to Ranking (in the menu on the left side of the panel) and check what sales results were achieved by individual team members in a given period, and who did best.
4. Monitoring the achievement of targets and results
One of Livespace’s features that enhance monitoring is the balanced scorecard, which pertains to both targets and results, and which is extremely useful for both the manager (e.g. when giving feedback) and the employees (overview of the achievement of the objectives motivates them and allows them to improve their performance before the end of the settlement period).
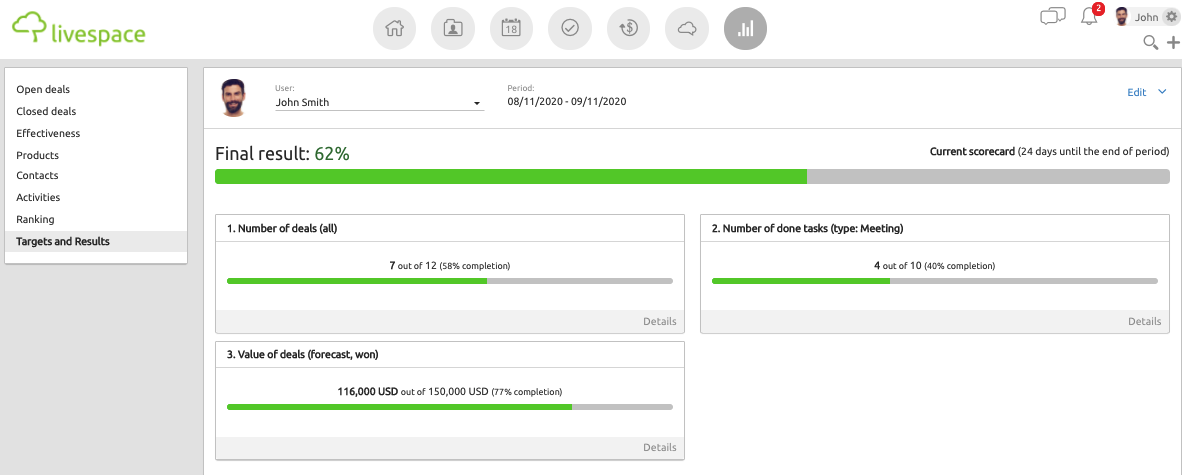
The scorecard makes it possible to set clear rules for evaluating the work of salespeople in the area of their activities, and thus helps to manage the team more effectively.
To create a scorecard, select Statistics > Targets and results from the menu, then select a settlement period and create a card for the team or for individual users.
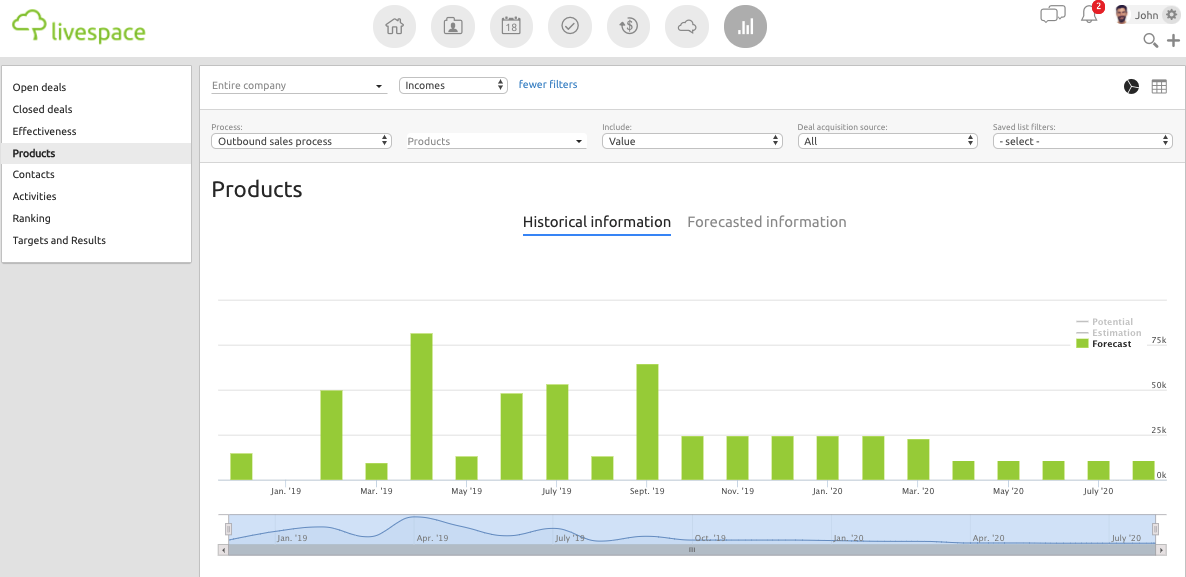
5. Verifying planned sales
In Livespace, you can add the forecast and realized values of products, which fact will allow you to distinguish planned sales from actually completed sales. Product statistics make it possible to quickly assess the extent to which the forecast products sales have actually been executed.
To see product statistics, go to Statistics and select Products from the list on the left.
By comparing graphs in Historical information, you can see to what extent your initial assumptions about the value of products are consistent with actual sales.
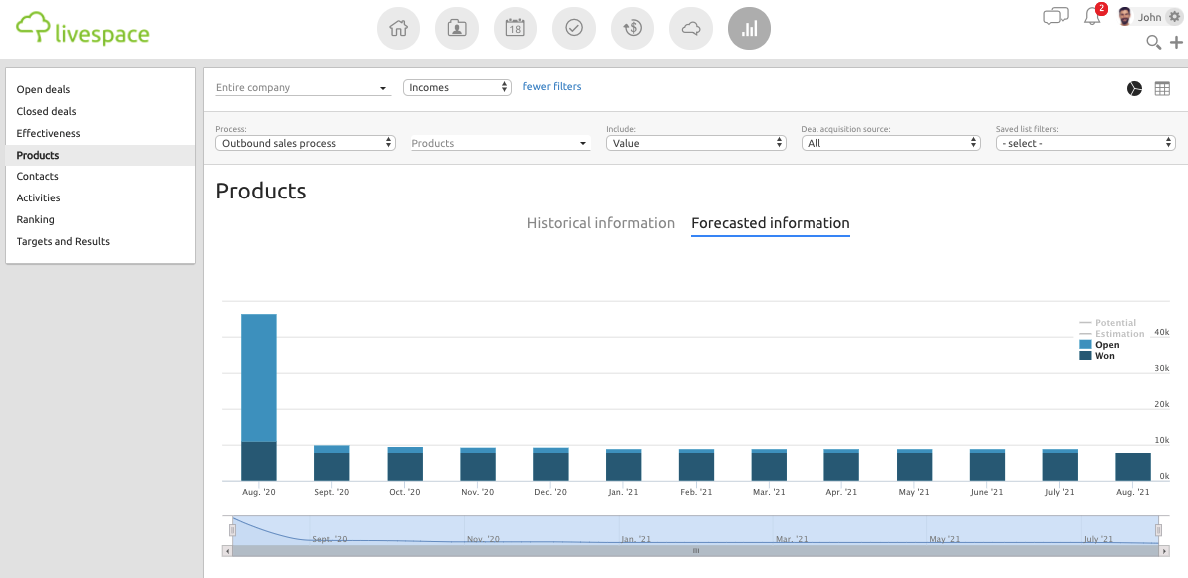
 Forecasted information (the second graph in Products) pertains to the future, i.e., the product values that you expect to achieve.
As you can see, in Livespace, not only can you plan the salespeople’s activities in the sales process, but also plan the tasks and monitor the performance of the team and of sales.
Other posts
What is CRM? Everything you need to know
 Livespace
3 most common software house sales mistakes. Make sure you won’t make them.