CRM reporting: The beginner’s guide for sales managers

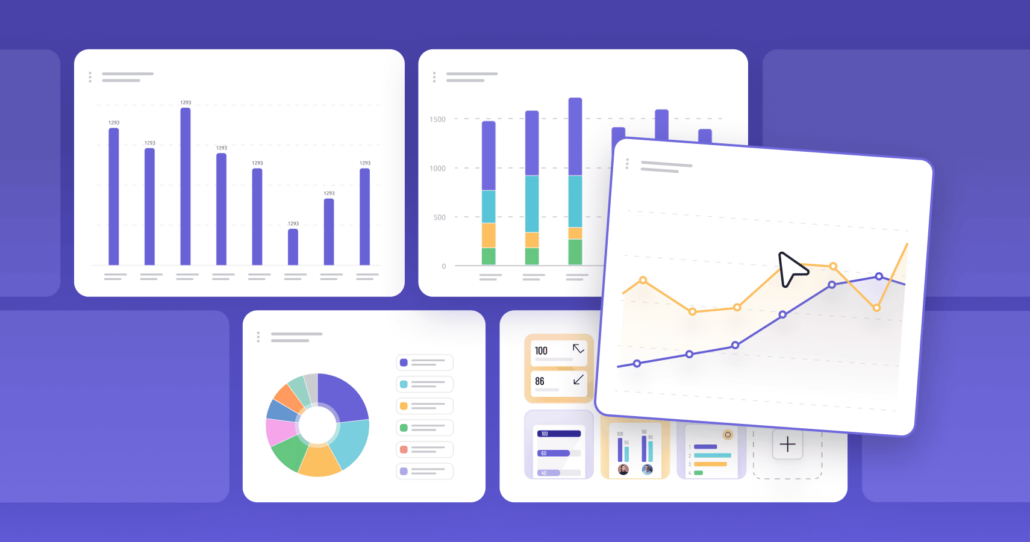
Table of Contents:
When going into CRM reporting for the first time in your sales career, it can feel like stepping into a sea of data. If you have a solid sales experience on the front lines, but have limited knowledge on analytics and sales reporting, this beginner’s guide will help you cut through the noise.
What is CRM reporting?
CRM reporting is the process of gathering and analyzing sales data from your Customer Relationship Management (CRM) system to track performance, spot trends, and make informed decisions. It helps sales managers understand what’s working, what’s not, and how their team is progressing toward goals.
Instead of drowning in raw data, CRM reports organize key sales metrics – such as revenue, pipeline health, and customer interactions – into easy-to-read dashboards and charts. This allows sales managers to quickly see which deals are moving forward, which reps need support, and where to focus their efforts to improve results.
Think of CRM reporting as your sales team’s scoreboard. It provides real-time insights so you can make smarter, faster decisions without relying on gut instinct alone.
Why is CRM reporting important for sales managers?
Helps you change or optimize your entire sales process
CRM reporting helps sales managers optimize their entire sales process by providing data-driven insights that allow them to track performance, identify bottlenecks, and adjust strategies accordingly. By using reports that cover key metrics such as sales opportunities, conversion rates, and sales velocity, managers can pinpoint areas where improvements are needed.
Example: If your sales team’s conversion rate from leads to opportunities is lower than expected and your CRM report shows that leads are getting stuck in the initial stage for too long, you know you need to take action. This might involve refining the lead qualification criteria, providing additional training on follow-up best practices, or motivating reps to engage with leads more quickly in order to improve conversions.
Keeps your team on track
CRM reports show if your team is on pace to meet sales targets, helping you act before problems arise.
Example: If your monthly revenue target is $100,000 and your CRM report shows you’ve only closed $30,000 by mid-month, you know you need to push harder in the coming weeks, whether by motivating reps, prioritizing high-value deals, or adjusting sales tactics.
Identifies top opportunities
Instead of chasing every lead, CRM reports highlight deals that are most likely to close, allowing you to focus your efforts effectively.
Example: Your CRM report may show that deals in a specific industry (e.g., SaaS companies) close 30% faster than others. With this insight, you can direct your team to prioritize similar prospects, increasing efficiency and revenue.
Improves coaching
CRM data helps you understand individual sales reps’ strengths and weaknesses, so you can provide targeted coaching.
Example: If a report shows that Rep A is great at booking meetings but struggles to close deals, you can coach them on negotiation techniques or assign them a mentor. On the other hand, if Rep B has a high close rate but few new opportunities, you may encourage them to prospect more actively.
Saves time
Instead of manually tracking progress in spreadsheets, CRM reporting automates data collection and analysis, making decision-making faster and easier.
Example: Instead of asking each rep how many calls they made or deals they closed, you can generate a report in seconds that shows key sales activities, saving hours of admin work.
Justifies strategy changes
When making decisions – whether it’s increasing budgets, shifting markets, or tweaking sales tactics – data-driven reports give you the proof you need.
Example: If a CRM report reveals that outbound cold calls generate only a 5% conversion rate, but warm referrals convert at 30%, you can justify reallocating resources toward referral programs instead of traditional cold outreach.
In short, CRM reporting isn’t just about numbers, it’s about gaining insights that help you lead with confidence and drive better sales results.
What is the difference between standard sales reports vs custom sales reports?
While standard sales reports are a great starting point for first-time managers, they can quickly fall short as your business grows and your sales processes become more complex. At some point, you’ll want more flexibility – to reflect your company’s specific goals, workflows, and data points. That’s why it’s important to use a tool that offers both: ready-to-use templates for the most common reports and powerful customization capabilities for everything else.
With custom sales reports, you can focus on the metrics that really matter to your team, all directly within your CRM. For teams that need to go beyond surface-level insights, standard reports only scratch the surface. Custom ones offer the freedom to tailor everything to match your business, process, and strategy.
What’s great about the new reporting in Livespace is that it gives you exactly that flexibility. You can build your own reports using pre-configured, ready-to-click templates, perfect for quickly creating dashboards. Even better, data from various reports across Livespace is now accessible in a single view. You’ll also be able to configure elements that aren’t even available in other CRMs, giving you full control.
What really sets it apart is the ability to combine data from multiple sources – contacts, opportunities, activities – into one cohesive dashboard. Think of it as your 360° view of sales performance. You can even merge sales processes into a single funnel, giving you insights like how many contacts were generated, how many deals created, and your overall conversion rate from open to closed-won.
We’ve also added advanced metrics like Sales Velocity, a powerful indicator of pipeline health. It multiplies number of open opportunities by average deal value by win rate divided by sales cycle length
This gives you a real-time view of how fast and how much you’re selling over time – whether by week, month, or quarter – helping you spot trends and react quickly.
And that’s just the beginning. New data points are being added soon, including building blocks like “emails by mailbox” and others that you can mix and match to create tailored views. Eventually, there may even be an SQL option for advanced users, like having Business Intelligence, but built specifically for sales teams.
Too often, sales managers are stuck choosing between overly rigid CRMs with no flexibility, where you have to build everything from scratch. With Livespace, you get the best of both worlds: structured reports when you need them, and the freedom to build whatever you want once you’re ready.
It’s like LEGO for sales reporting — start with the basics, then build exactly what your team needs.
There are a few reports, which I think are critical from a sales manager’s perspective. Keep them in mind while choosing your CRM software.
1. Lead Qualification Funnel
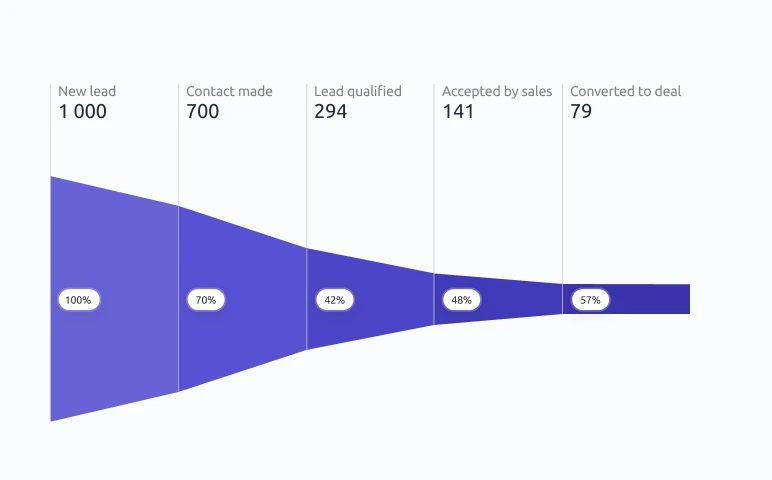
This report shows how leads move through each stage of the qualification process — from first contact to being passed on to the sales team. It visualizes volume at each step and the drop-off rate between them, giving you a clear picture of where prospects are in your pipeline and where they’re falling out.
Benefits: Helps identify where leads are being lost and which stages need improvement — whether it’s follow-up timing, qualification criteria, or messaging. This visibility allows you to optimize your qualification process and ensure fewer high-quality leads slip through the cracks.
Example use case: The sales manager notices a significant drop between “contact made” and “need confirmed.” After reviewing the script and qualification flow, the team updates its lead scoring process and improves follow-up timing. Within a month, the conversion rate between these stages improves by 25%, resulting in more qualified opportunities entering the pipeline.
This type of report is particularly valuable because it focuses on the early stages of your sales process, where small improvements can have massive downstream effects. If you can increase your qualification rate by even 10%, that translates directly into more opportunities and, ultimately, more closed deals.
2. Deals Closed per Sales Rep
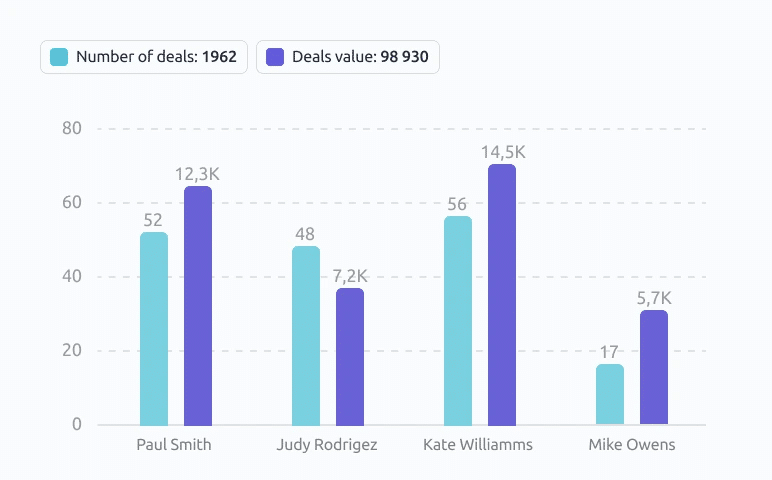
This report shows how many deals each rep has successfully closed over a selected period. Results can be filtered by time, source, or team, giving you flexibility to analyze performance from multiple angles.
Benefits: Allows managers to measure individual performance, track consistency, and identify top performers as well as those needing support. It’s essential for fair performance evaluations and helps you spot patterns in success that can be replicated across the team.
Example use case: A team is launching a new product. The manager checks which rep is closing the most deals and invites them to share their approach in a team training session. The top performer reveals they’ve been focusing on specific objection-handling techniques that resonate with prospects. The manager rolls out this approach to the entire team, leading to a 20% increase in overall close rates for the new product.
What makes this report particularly powerful is its simplicity – it cuts straight to the bottom line. While other metrics matter, deals closed is the ultimate measure of sales success. It helps you identify who’s consistently delivering results and who might need additional coaching or support.
3. Win Rate by Time and Source
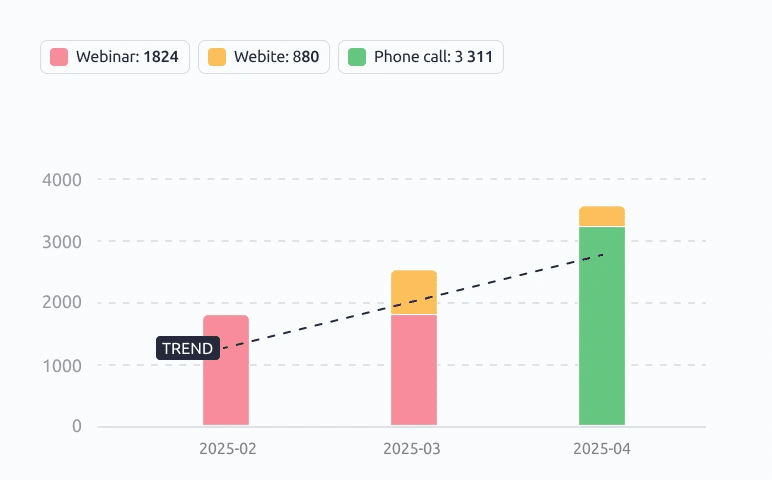
This report displays volume of deals won, broken down by lead source (e.g., form, referral, call) and time period (e.g., monthly or quarterly). It gives you both the quality perspective of where your best leads come from and the temporal view of how your team’s performance evolves.
Benefits: Helps compare the quality of leads from different sources and track performance trends over time. This dual perspective allows you to optimize both your lead generation strategy and identify seasonal or cyclical patterns in your sales performance.
Example use case: Marketing notices that leads from webinars convert better than those from paid ads – 45% win rate versus 25%. They shift more budget toward educational campaigns to maximize efficiency. Additionally, they notice win rates dip every Q4, so they adjust expectations and increase activity levels during that period to maintain revenue targets.
This report is crucial for aligning sales and marketing efforts. When you can clearly see which sources produce the highest-converting leads, you can guide marketing to double down on those channels. It also helps set realistic expectations and quotas based on historical performance patterns.
4. Average Deal Value (Month over Month)
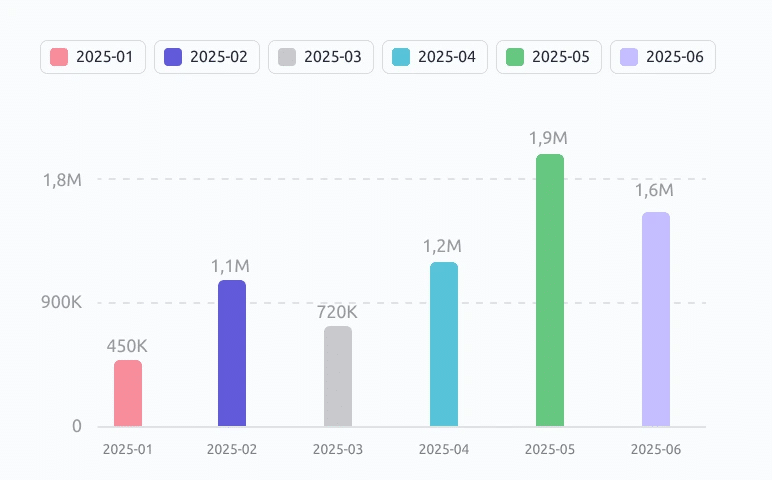
This report tracks how the average value of closed deals changes month to month, providing insight into whether your deals are getting larger or smaller over time and helping you spot trends in customer behavior.
Benefits: Useful for spotting pricing trends, changes in customer behavior, and the impact of promotions or new offerings. It also helps you understand if your team is moving upmarket or if external factors are affecting deal sizes.
Example use case: The average deal value increases steadily after launching a bundled offer – from $5,000 to $7,500 over three months. Sales decides to focus on upselling the bundle as a core part of the pitch, and they update their sales materials to highlight the bundle’s value proposition. This strategic shift results in sustained higher deal values and improved profit margins.
This report is particularly important for forecasting and resource planning. If deal values are trending upward, you might need fewer deals to hit your targets. If they’re trending downward, you’ll need to increase volume or investigate what’s causing the decline.
5. Lost Deal Reasons
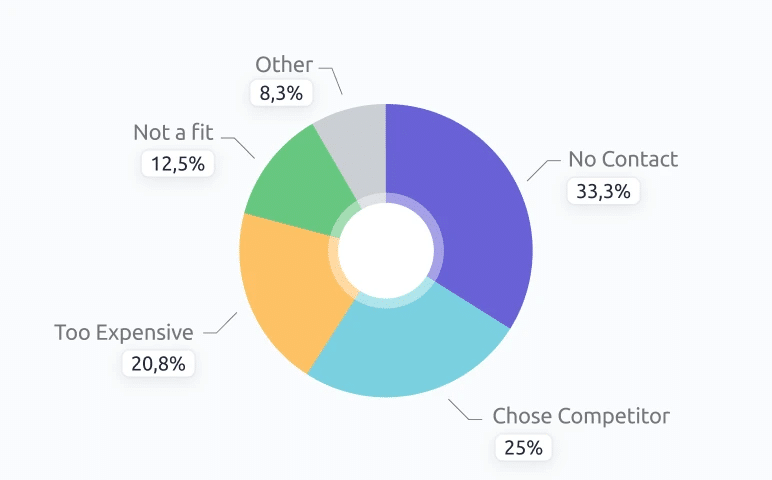
This report breaks down the most common reasons deals are lost — such as no decision, budget constraints, or competition — with filtering options by product, team, or time. It provides crucial insight into what’s preventing your team from closing deals.
Benefits: Gives insight into what’s blocking sales from closing and guides improvements in messaging, qualification, or offer structure. Understanding why deals fail helps you address root causes rather than just symptoms.
Example use case: The team discovers that “no contact” is the top reason for lost deals at 33.3%, followed by “chose competitor” at 25%, and “too expensive” at 20.8%. To address the contact issue, they implement a more aggressive follow-up sequence and improve lead response times. For competitive losses, they enhance their differentiation messaging and competitive battle cards. To tackle pricing objections, they introduce value-based selling training and develop ROI calculators. After these targeted improvements, “no contact” losses drop to 20%, and overall win rates improve significantly.
This report is invaluable for continuous improvement. Every lost deal is a learning opportunity, and when you can spot patterns in why deals fail, you can proactively address those issues in future opportunities. It’s also helpful for competitive analysis – if you’re losing frequently to specific competitors, you know where to focus your differentiation efforts.
6. Sales Rep Activity Report
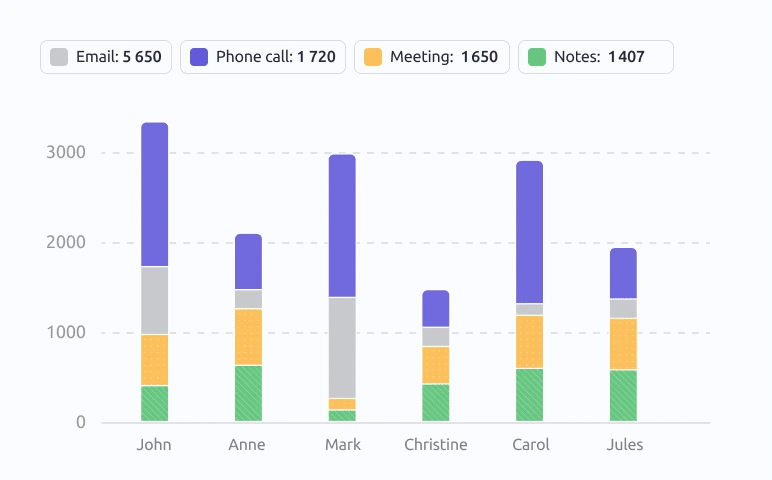
This report tracks the number of actions completed by each sales rep — including emails sent, calls made, and meetings logged — within a given timeframe. It provides visibility into the effort and activity levels across your team.
Benefits: Reveals how active each rep is and allows for comparisons between effort and results. This helps identify if performance issues are due to skill gaps or activity levels, guiding your coaching approach accordingly.
Example use case: The top-performing rep consistently logs more calls than the rest of the team. The manager analyzes their workflow and encourages others to adopt similar habits, including better time blocking and more focused prospecting sessions. The team’s overall activity increased, leading to more opportunities and higher revenue.
This report helps answer a critical question: are performance differences due to skill or effort? If a rep is making plenty of calls but not closing deals, they likely need skills coaching. If they’re closing at a good rate but not making enough calls, they need activity coaching. It’s an essential tool for targeted performance improvement.
Note: You can filter all these reports by individual sales reps, time periods, lead sources, and other relevant criteria. This means you can easily compare how different teams are performing or benchmark one salesperson against the team average. It helps identify top performers, spot areas where extra support might be needed, and drive healthy competition within the team. This kind of granular visibility supports more informed coaching and better resource allocation.
CRM reporting software for sales managers
Without previous experience, getting a handle on CRM reporting tools can feel overwhelming – especially when you’re faced with either overly rigid reports or the need to build everything from scratch. Livespace strikes a balance between both of these options. It gives you access to ready-to-use reports for immediate insights while also offering flexibility to customize your CRM reporting as your needs evolve.
If you’re a first-time sales manager, we recommend trying out Livespace – schedule a demo to see how quickly and intuitively you can use reporting in our CRM!
Other posts
The Beginner’s Guide to Sales Forecasting (For Sales Directors & Managers)

How to shorten the sales cycle in 9 easy steps