Know Your Benchmark: B2B Sales Benchmarks Report for 17 Industries
Table of Contents:
What sales metrics do you measure? And, most importantly, how do you know if you’ve got good or poor results?
We’re here to help you with our B2B Sales Benchmarks Report. We’ve covered four metrics, dividing it for 17 industries.
Check out what’s inside and how to work with the benchmarks!
B2B win rate: 44%
What is a win rate?
The win rate is the percentage of deals you win compared to all deals you close (both won and lost). It shows how effective your sales process is at converting deals into customers.
We see two common approaches towards calculating the win rate:
- From lead to won deal
- From open deal (sales qualified lead) to won deal
But only the second one is correct. Here’s why:
In general, successful B2B businesses use at least 2 sales processes (sales funnels):
- One for lead qualification → which you measure with conversions
- Another for sales process → and here you can count the win rate
If you have just 1 sales funnel (from lead to won deal), then the win rate will be much lower, as the majority of your leads will never be qualified to sales deals.
Plus, it makes analysis and conclusions much harder.
How to count it?
Divide the number of won deals by the total number of closed deals (won + lost) and multiply by 100.
For example: 22 won deals ÷ 50 total closed deals × 100 = 44% win rate.
My win rate is significantly lower than the industry benchmark – why?
Several factors can cause this difference:
- You are using one sales funnel (process) for leads qualification and sales.
- Your sales process might target different types of customers
- Your qualification criteria could be stricter or looser than industry standard
- Your pricing strategy might affect which deals you pursue
- The complexity of your product or service could impact conversion rates
Time to win: 41 days
What is time to win?
Time to win is the average number of days it takes to close a successful deal, from the first contact to winning the deal.
How to count it?
Add up the total number of days for all won deals and divide by the number of won deals.
For instance: 820 total days ÷ 20 won deals = 41 days average time to win.
My average time to win is way higher than my industry benchmark – why?
Common reasons for variation include:
- The bigger the company you are targeting, the longer the time
- Enterprise sales has over 1 year time to win;
- Looking at our clients’ data, they sell to SMB businesses or B2C, so they get shorter sales cycles
- The complexity of your sales process
- Your target customer’s decision-making process
- The number of stakeholders involved
- Your pricing tier and approval requirements
Time to close: 44 days
What is time to close?
Time to close is the average time it takes to reach a final decision (won or lost) on closed deals. Unlike the sales cycle which includes active deals, time to close only looks at completed deals to give you a clear picture of your actual closing speed.
- Sales cycle: takes into account both closed and open deals
- Time to close: narrows down to closed deals
How to count it?
Add up the total sales cycle duration for all closed deals (won and lost) and divide by the total number of closed deals.
For example: 2,200 total days ÷ 50 closed deals = 44 days average time to close.
My time to close is way higher than the industry benchmark – why?
Key factors that can explain the difference:
- Your lead qualification process (the crucial one!)
- The length of your sales cycle
- How quickly you identify and disqualify poor fits
- Your follow-up frequency and engagement strategy
SALES PROCESS BUILT AROUND YOUR CUSTOMERS: FREE WEBINAR
Not knowing why it takes so long to close a deal? The answer might lie in your sales process.
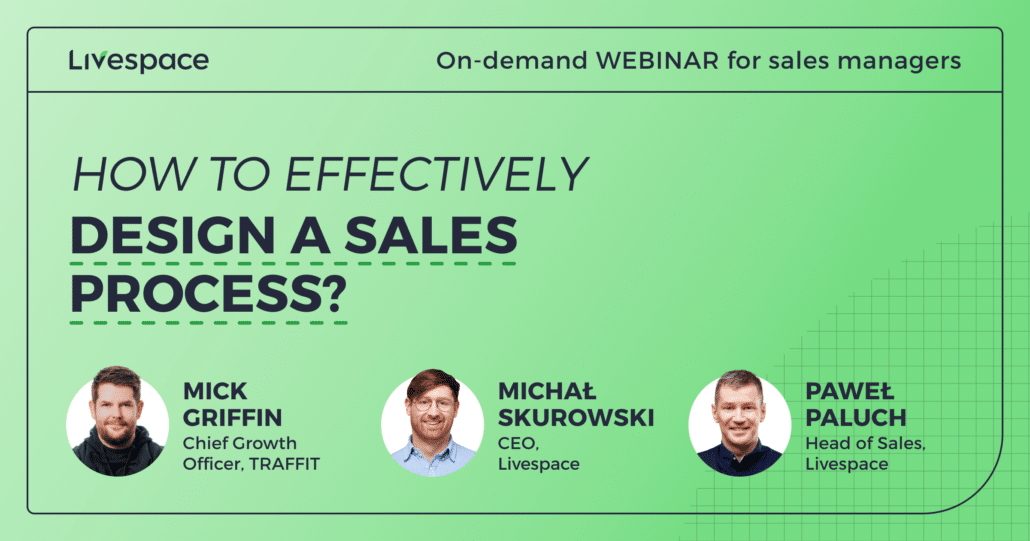
Check out our Sales Process Design webinar where you’ll learn how to analyze and upgrade your sales process!
Number of sales processes: 3
2.91 to be exact. And that proves our point: rarely you can have just one sales process and work efficiently.
Why should you have more than 1 sales process?
A sales process is a set of steps to close a deal. And, as your customers differ, usually one-set-fits-all doesn’t work – especially when your deals are at different lifecycle stages.
Let’s take 3 different stages here as examples.
- Leads nurturing
Goal: make leads interested in your offer
In this stage you usually get people somewhat interested in your offer, but who haven’t shown strong buying signals – at least not yet. That’s why you usually use an (automated) flow of emails, LinkedIn messages or phone calls to warm those leads up and make them interested in your offering. - Leads qualification
Goal: learn if the leads are a good match for your business
This process helps you ensure you sell to the right people. It helps you minimize the effort waste and get better win rates in the sales process. As that, you usually talk with clients about their needs and plans to find out if they’re really willing to buy a solution.
Check various qualification frameworks in our Sales Methodology Overview - Sales process for deals
Goal: Get paying customers
Finally, sales happen here! In this stage, you craft an offer, overcome objections, and finally close the negotiations – hopefully by getting another paying client.
As you can see, each of those processes have different goals and methods used to reach them.
Apart from that, there are other factors to consider, like:
- Different client sizes or markets,
- Outbound or inbound leads,
- Or even when your prospect is your ICP or not!
Learn more about sales processes in our Guide to sales process for sales managers!
How did we count it?
Our data is based on over 1200 Livespace customers (small and medium businesses). We calculated the average results from the beginning of 2022 until the end of Q3 2024 to ensure a relevant dataset.
How many industries have we covered?
We’ve prepared benchmarks for a total of 17 industries:
- IT Services & Software Development
- SaaS & Web/Mobile Applications
- Marketing, Events & PR Agencies
- Real Estate & Investment
- Renewable Energy & Solar Solutions
- Financial Services & Insurance
- Media & Publishing
- Manufacturing & Construction Materials
- Business Consulting & Training
- Sports, Recreation & Tourism
- Healthcare, Medical Services & Aesthetics
- Automotive Dealerships
- Professional Services & Law Firms
- Specialized Equipment Distribution
- Transportation & Logistics
- Education & Training Institutions
- Public Services
We’ve gathered enough representative data for each of them to give you relevant benchmarks. If you can’t see yours on the list, probably we haven’t got reliable numbers.
How to make the most of B2B sales benchmarks?
Turn insights into action
Use benchmarks to identify your biggest improvement opportunities. If your time to close is significantly higher than the benchmark, analyze your sales stages to find bottlenecks. Then create specific action plans to address these gaps.
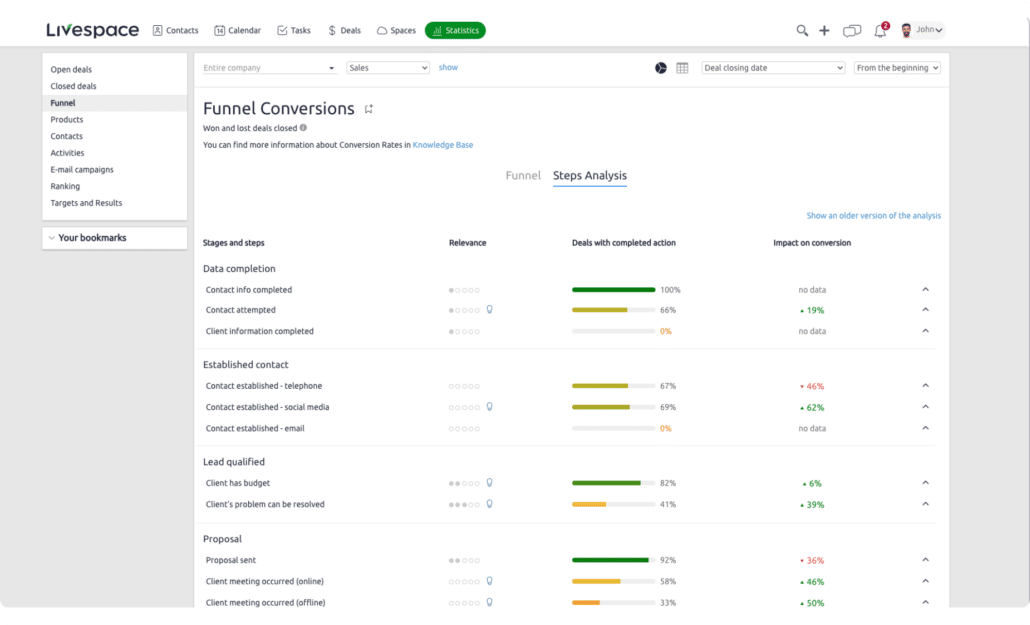
We’ve made it easier for our clients. As we track all the steps performed across the sales process, we can show you the impact on conversion they have.
Track progress systematically
Set up regular reviews in your CRM. Monitor how your metrics change as you implement improvements. This helps you validate which changes are working and which need adjustment.
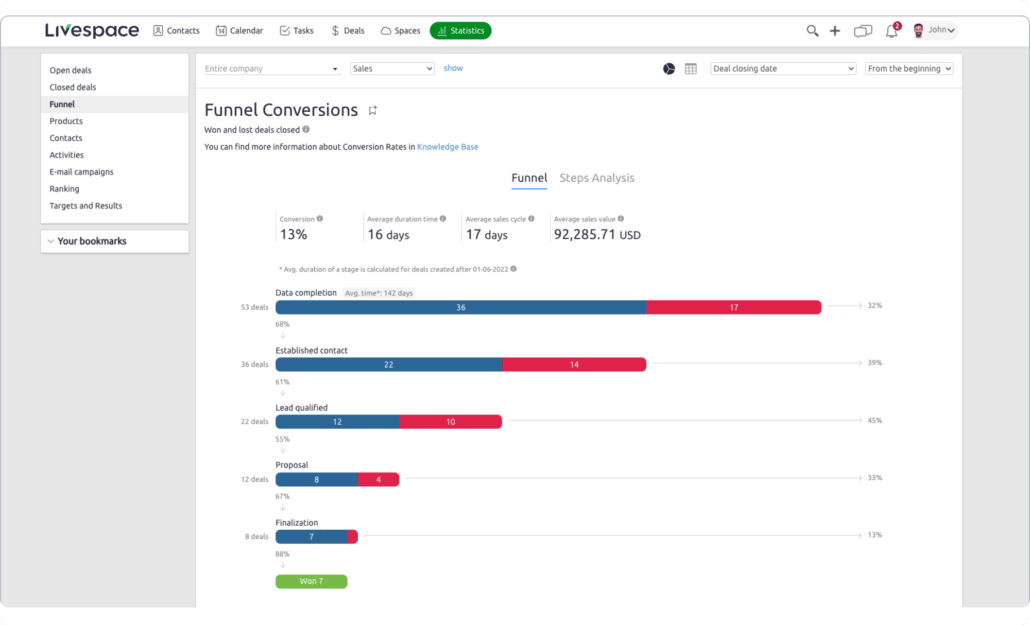
In Livespace, you can easily access the data about your average sales cycle and time to close.
Remember that sustainable progress often comes from small, consistent improvements rather than dramatic changes.
Other posts
Closing Deals: 7 Proven Ways to Close B2B Deals Faster (Even in a Tough Market)
Choosing a CRM – 10 common mistakes and how to steer clear of them
